The problem
Wikipedia changes every second, and those edits are a live picture of what the world is paying attention to. But the raw feed is unreadable: page titles, byte counts and terse edit summaries. At Hack the Burgh 2025, our team of 6 built WikiWatch to show the climate of Wikipedia: what's changing right now, and whether the mood is positive or negative.
My approach
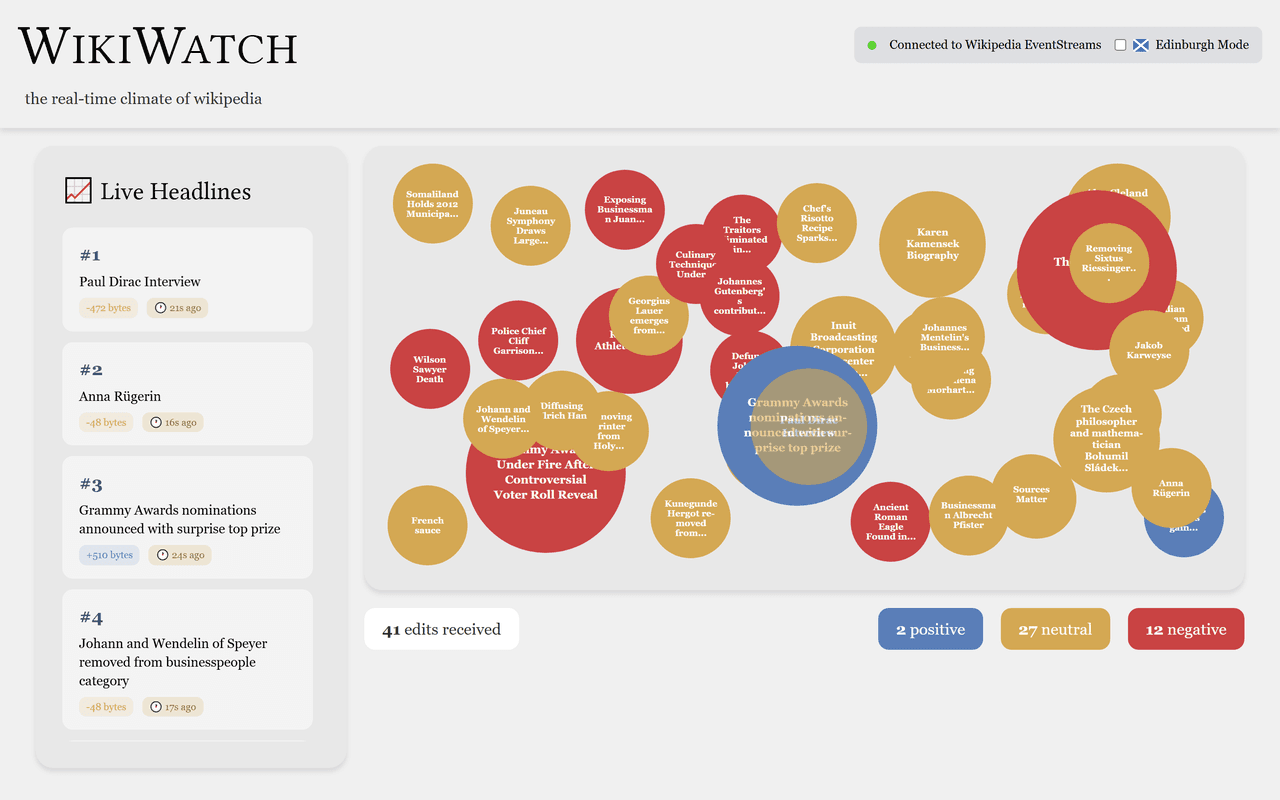
- From edits to headlines. WikiWatch reads Wikimedia's live RecentChanges stream, filters out bots, talk pages and tiny edits, and asks a local Llama 3.2 model, through Ollama, to turn each edit into a short newsroom-style headline.
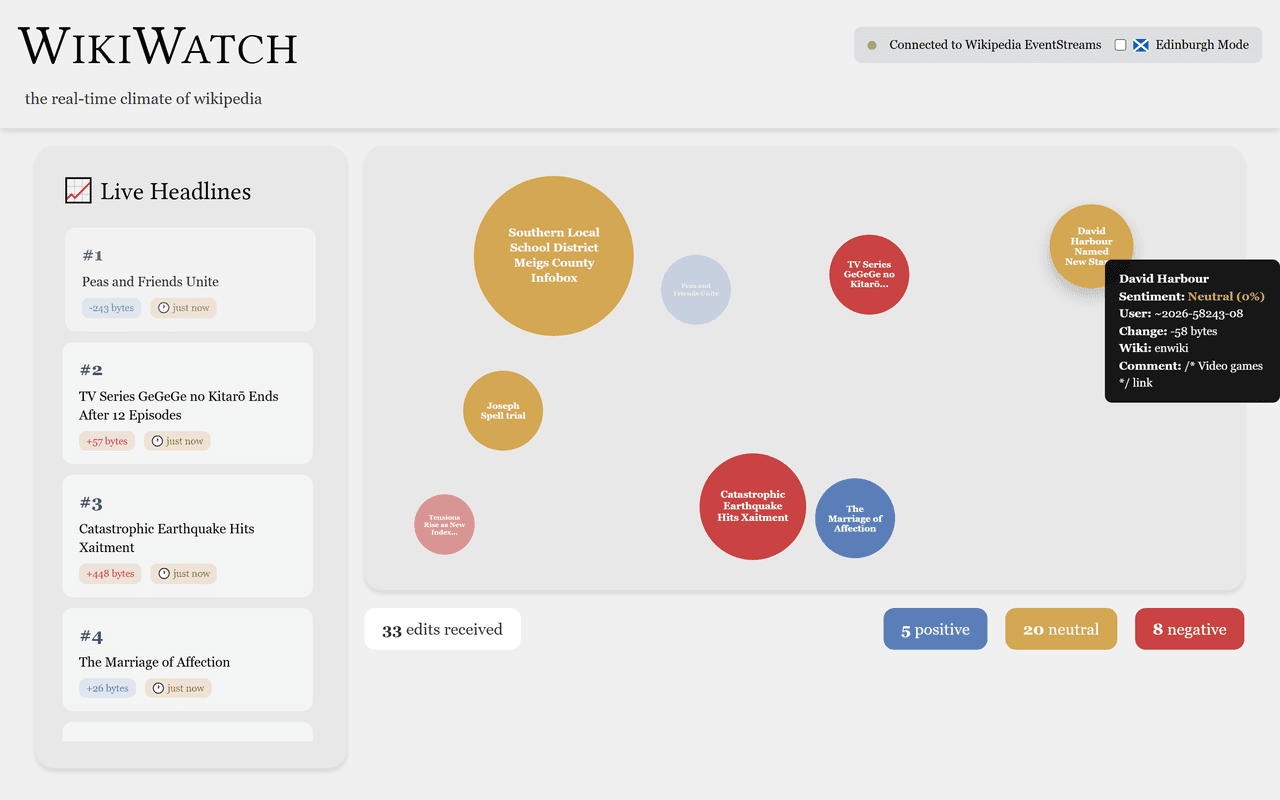
- Reading the mood. Each headline is scored with VADER sentiment analysis and sorted into positive, neutral or negative.
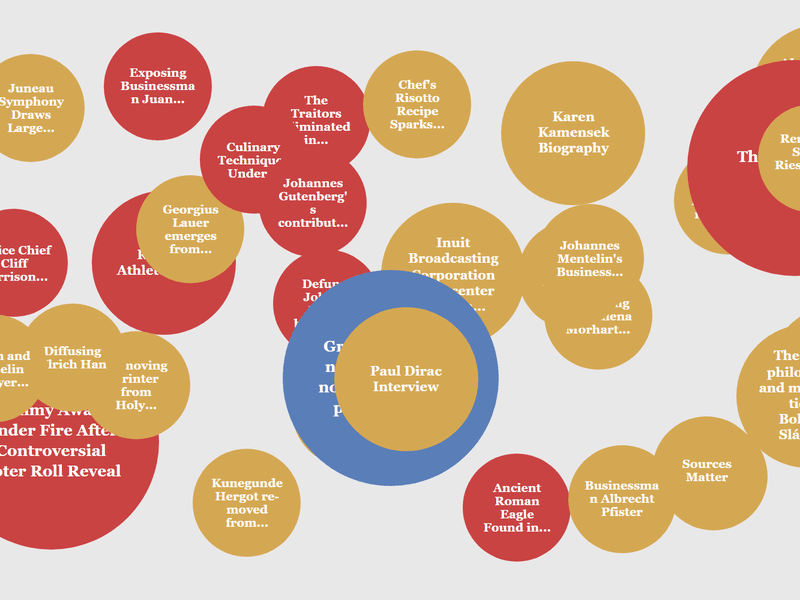
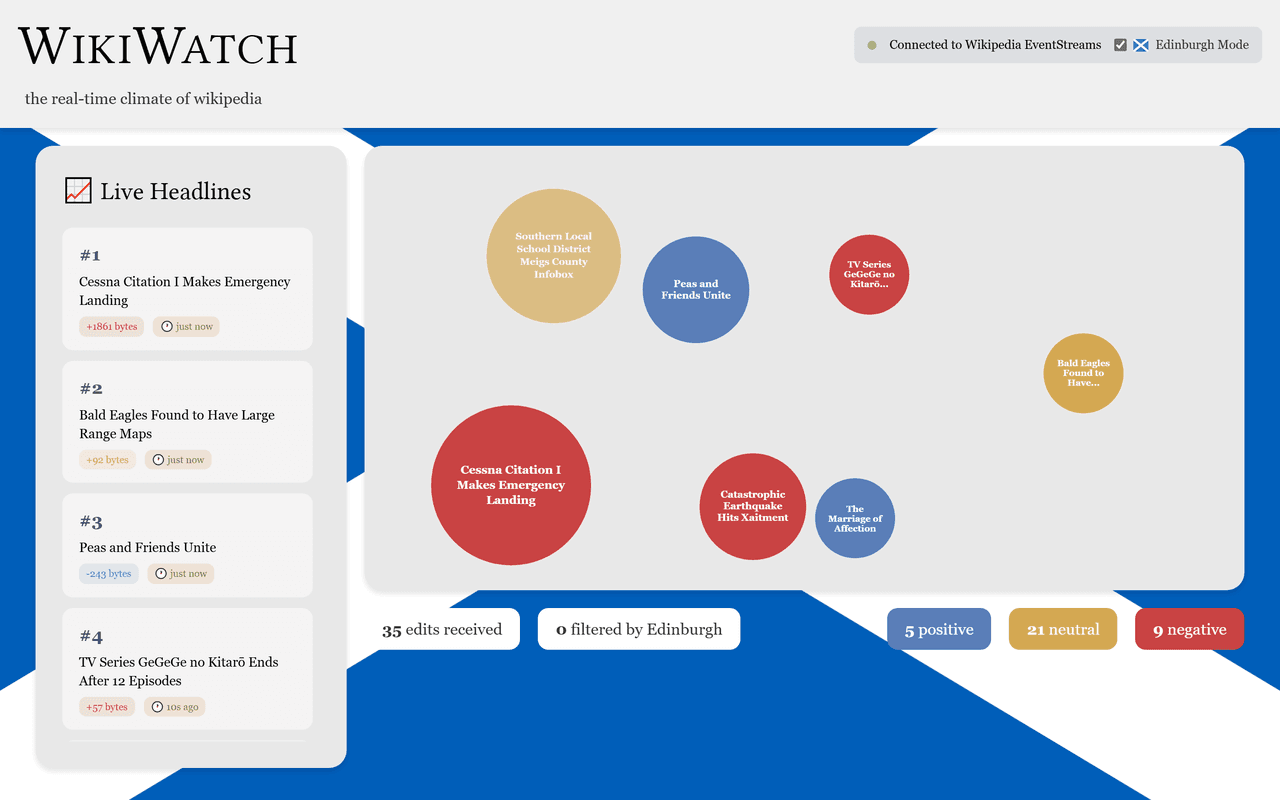
- A lively front-end. Inspired by Listen to Wikipedia, the interface shows headlines as they arrive, with running counts for each mood.
My part was the front-end: I moved the interface to a Next.js and React app and built the live feed of headlines and the positive, neutral and negative stats.
The code is on GitHub (opens in a new tab).
What I learned
- A small local model is enough for a focused job like writing one headline, and keeps the whole thing free and private to run.
- Live data needs filtering before it's interesting. Most edits are bots and housekeeping, and cutting them out mattered more than anything the model did.
- In a hackathon, a working end-to-end slice beats a perfect part. Getting edits flowing onto the screen early gave the whole team something to build on.